A Complete Guide to Understanding your Website’s Engagement Metrics


Customer engagement has always been an important factor for businesses — even in the pre-internet era.
If you were a brick-and-mortar store owner, you could see the customer journey in-person. The customers’ behaviour such as how they navigate through your store, engage with display products, talk to your sales/support staff and so on — everything is visible and audible.
But how do you track your customers’ interactions with your business website?
The answer is Website Engagement Metrics.
In this guide, we’ll discuss:
- What engagement metrics are
- Importance of tracking your website engagement metrics
- The key engagement metrics
Moreover, with each metric, we’ve also shared how to track them in Google Analytics and some quick SEO tips to improve these metrics.
Let’s jump right in.
Importance of Tracking Engagement Metrics
Here are a few reasons why you should track the engagement metrics:
- Determines the quality of content: If users are engaging well with your web pages, it indicates that they’re happy with your content and may keep revisiting your site. If they don’t, you need to improve your content strategy and quality.
- Impacts revenue: High engagement level means that your site is able to meet the users’ expectations. The more they engage, the higher the chances that they’ll convert into leads and paying customers. Thus, it can influence your revenue and profitability.
- Reveals opportunities for improvement: Weak engagement level provides you valuable insights into improvement areas within your site. For instance, an unusually high bounce rate on a specific page may be an indicator that it’s not aligned with the user’s search intent and needs to be corrected.
With that in mind, let’s dive into the key engagement metrics that you must track.
Key Website Engagement Metrics to Track
Since there are plenty of website metrics you can track, it can be overwhelming if you’re new to web analytics. So we’ve outlined some of the key metrics you can start tracking.
While all of these metrics are important, note that you shouldn’t draw conclusions by analysing a single metric in isolation. It’s always best to use them with other metrics to make better sense of the data.
1. Pageviews
Pageviews is one of the most basic engagement metrics. It indicates how many times a specific page from your site is loaded in the browser. So if the same visitor loads the page twice, it’s counted as two pageviews.
If your page views are growing consistently, it can be an indicator that your SEO and marketing efforts are in good shape.
Alternatively, it could also be the case that there are technical issues with the site and people have to reload the page frequently. And because of multiple reloads pageviews are multiplied.
That’s why you need to check it with other metrics to establish proper context.
How to Track
Log into your Google Analytics (also known as Universal Analytics) account and follow the steps below:
- Click the Audience tab on the side panel.
- Click Overview and you’ll be able to see the pageviews for a given period.

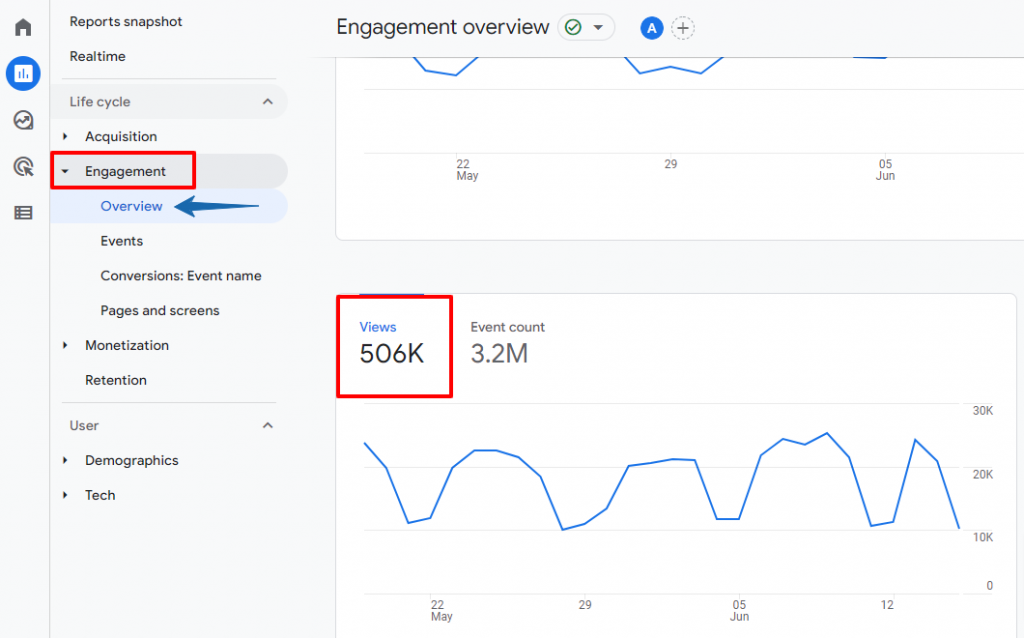
If you’re using Google Analytics 4 (GA4), then log into your GA4 account. And then:
- Click the Engagement tab on the side panel.
- Click Overview and you’ll be able to see the pageviews for a given period.
Quick Tips to Improve Pageviews Metric
- Write captivating headlines
- Promote related content resources on your site’s sidebar or within the content
- Invest in improving site user experience
2. Bounce Rate
Bounce rate is the percentage of users that leave your site right after viewing one page and without taking any action. It’s an important metric to keep a tab on.
If your site is able to attract a high amount of visitors but also has a high bounce rate, then your marketing and SEO efforts are getting wasted. It means that users are leaving unengaged and it shrinks the conversion opportunities.
A high bounce rate can be a signal that users either didn’t get what they were looking for or the content wasn’t interesting enough. Or else, there could be UX issues with your site.
How to Track
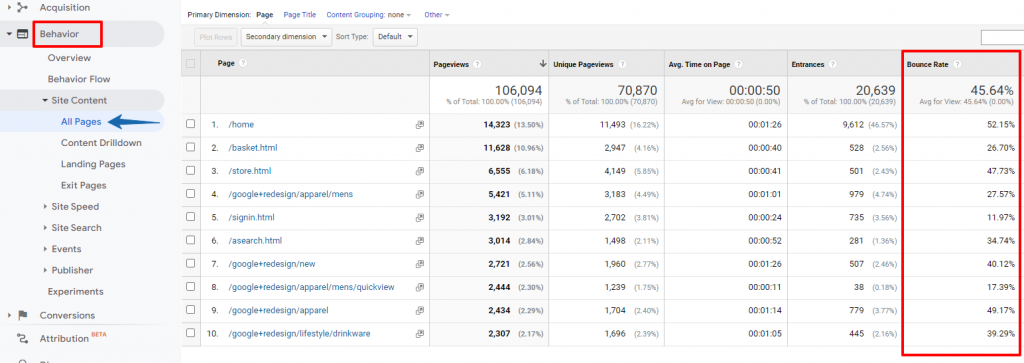
Universal Analytics:
- Go to the Behaviour tab on the side panel.
- Click the Site Content drop-down.
- Select All Pages and you’ll see the Bounce Rate data along with other metrics.
Google Analytics 4:
GA4 doesn’t have a Bounce Rate metric. Instead, it provides a metric called Engagement Rate. Here’s how you can find it:
- Go to the Acquisition tab on the side panel.
- Click User Acquisition.
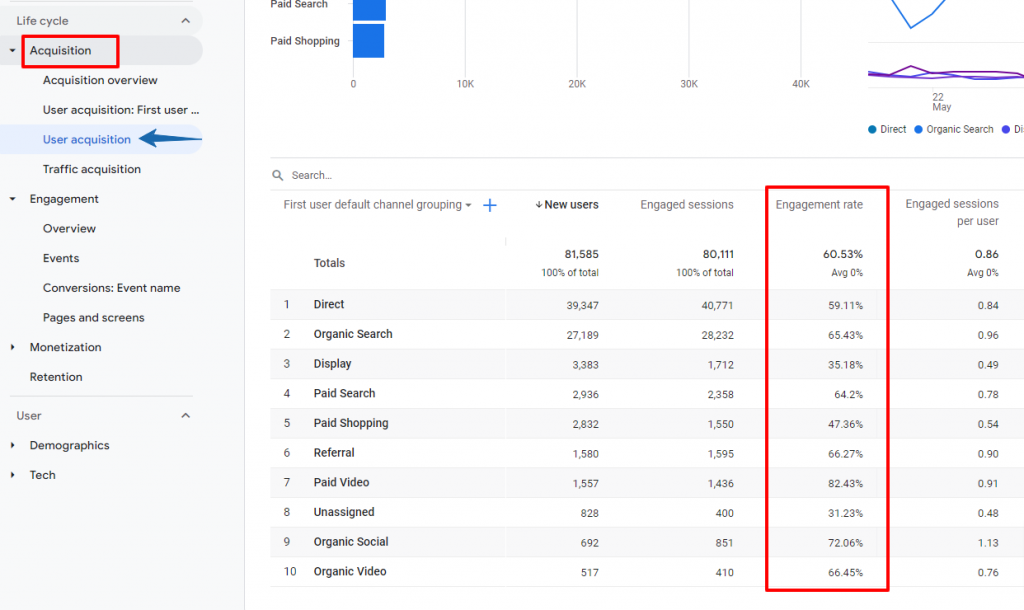
As you can see, you get an overall engagement rate and also channel-wise rates.
Quick Tips to Reduce Bounce Rate
- Create quality content and add relevant internal links in your content to guide users to different pages on your site.
- Match the searcher’s intent and create content accordingly.
- Provide a better user experience.
- Use clear, concise, and compelling CTAs.
3. Average Time on Page
Time on page metric measures the average time a user spends on your web pages. A higher average time on the page equals higher user engagement.
45% of the respondents in a survey, revealed that the average time spent on their blog is anywhere between three to five minutes. This metric can indicate whether users like your content and UX for specific web pages.
Here’s how you can analyse it:
Say your average blog post length is around 2500 words which can take up 10-12 minutes of reading time. But your Average Time on Page metric for these pages oscillates between one to two minutes.
Thus, readers are leaving too soon. It could be because they get bored or the on-page experience is not user-friendly.
How to Track
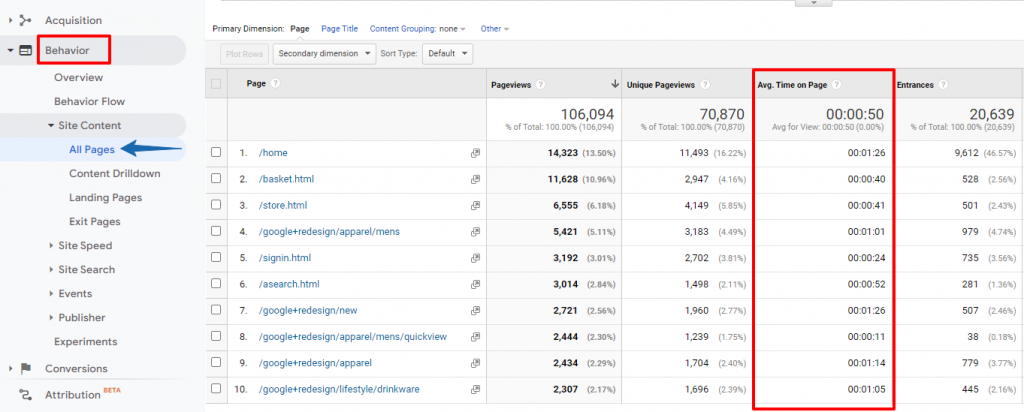
Universal Analytics:
- Click the Behaviour tab on the side panel.
- Go to Site Content drop-down.
- Select All Pages and you’d be able to see the Average Time on Page metric for all the pages on your site.
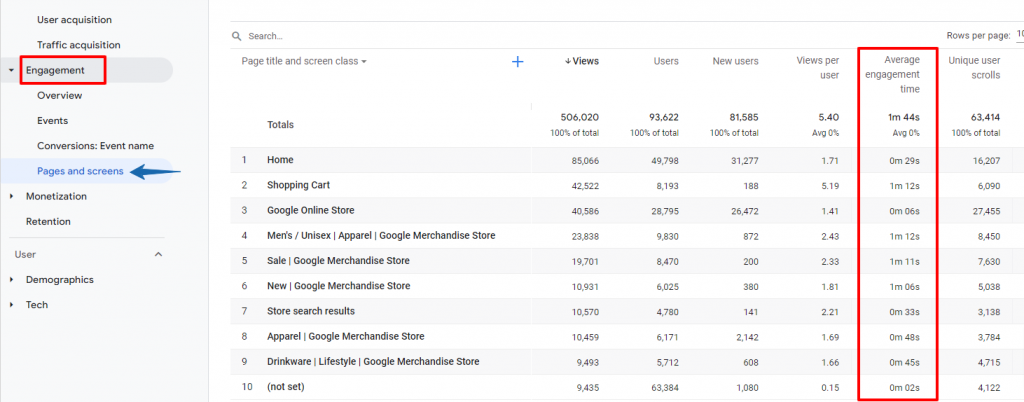
Google Analytics 4:
Average Time on Page metric has been replaced by Average Engagement Time in GA4.
Below are the steps to find it:
- Go to the Engagement tab on the side panel.
- Click Pages and screens.
Quick Tips to Improve Average Time on Page
- Use engaging multimedia content on web pages
- Focus on content readability
- Optimise page loading speed
4. Average Session Duration
Average Session Duration — previously Average Time Spent on Site — is the average time that a user spends on your site interacting with one or more web pages.
Ideally, you want to hold the visitors on your site for a longer duration so that you can increase engagement and conversion opportunities. Hence, the longer the session duration the better.
Average Session Duration provides better engagement insights as compared to Average Time on Page.
How to Track
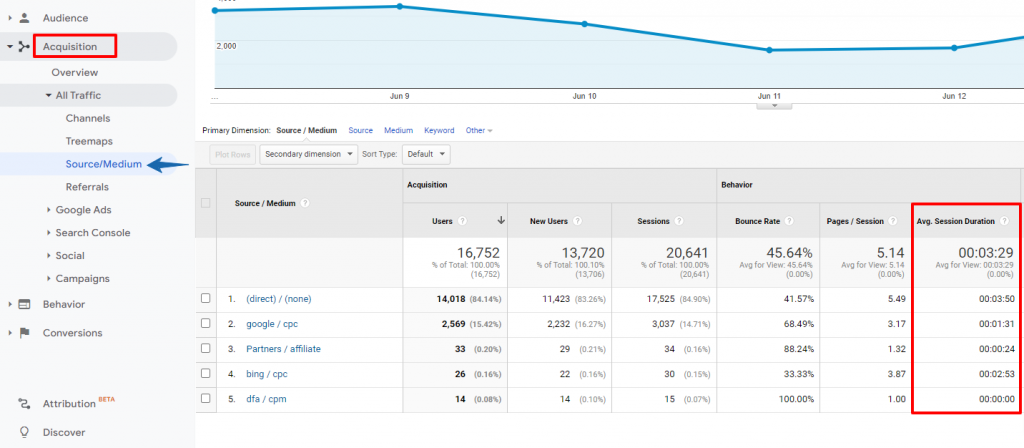
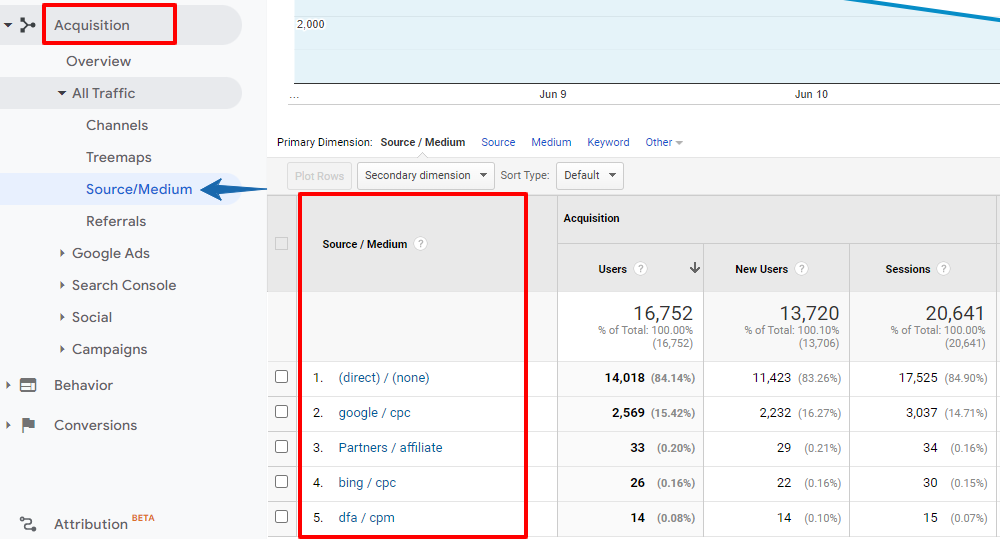
Universal Analytics:
- Go to the Acquisition tab on the side panel.
- Click All Traffic drop-down.
- Select Source/Medium.
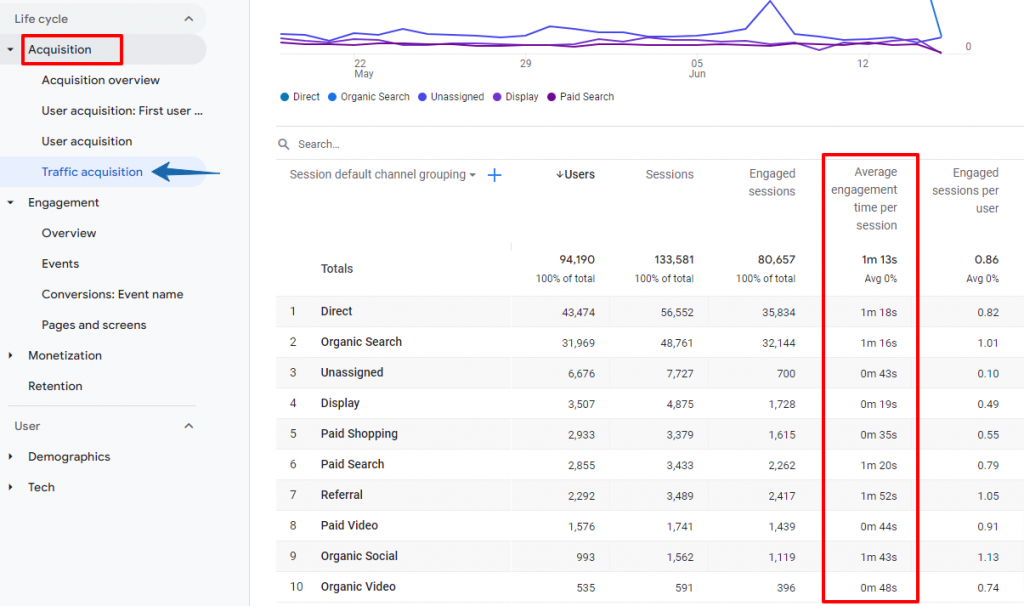
Google Analytics 4:
Average Session Duration is called Average Engagement Time Per Session in GA4. And here’s how to track it:
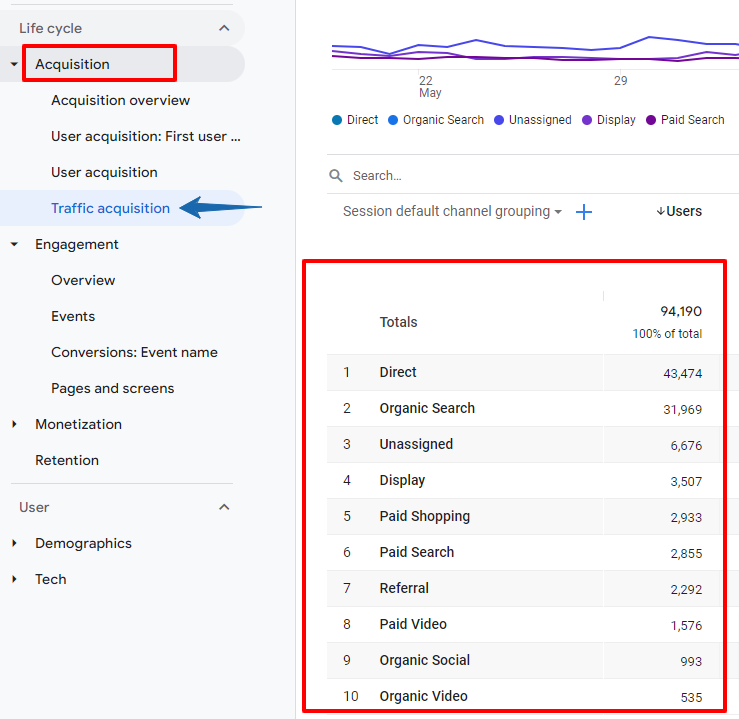
- Go to the Acquisition tab on the side panel.
- Click Traffic Acquisition.
Quick Tips to Increase Average Session Duration
- Include video content
- Break up text with high-quality engaging images
- Use a storytelling approach in content creation
- Improve site navigation with HTML sitemaps in the website footer
5. Scroll Depth
Scroll Depth metric helps you know how users consume content on your site or web pages. It tracks the depth up to which users scroll the page and then stop reading.
Scroll Depth data can suggest whether your content is interesting and readable to your target audience. But don’t use this metric as a standalone measure because some users may just skim through or scroll to the bottom of the page just to see if there’s anything that interests them.
So use this data with other engagement metrics.
How to Track
Google Analytics doesn’t have a built-in feature to access scroll depth reports. However, you can install a Scroll Depth plugin for GA.
It monitors scroll point depths like 25%, 50%, 75%, and 100% and sends the event data to GA.
Alternatively, you can also use Google Tag Manager to track the Scroll Depth metric.
Quick Tips to Improve Scroll Depth
Once you have the scroll depth data, try to find the patterns if certain pages are scrolled less than others. For the struggling pages:
- See if there’s any negative user experience at a specific page depth.
- Is content getting flat after a certain length?
In short, here you need to take a qualitative approach by studying different pages. Then correct the issues that you think might be causing challenges. And then test the pages for a certain duration.
At the same time, if you don’t have the in-house technical expertise, you can hire a competent SEO agency to help you resolve such issues.
6. Pages Per Session
Pages Per Session metric reveals the number of pages a user typically visits on your site during a session.
For instance, if users find your content valuable and interesting, they may want to check other pages also. Also, if you have interlinked your web pages where it can provide additional value to readers, they would navigate to those pages through the links.
How to Track
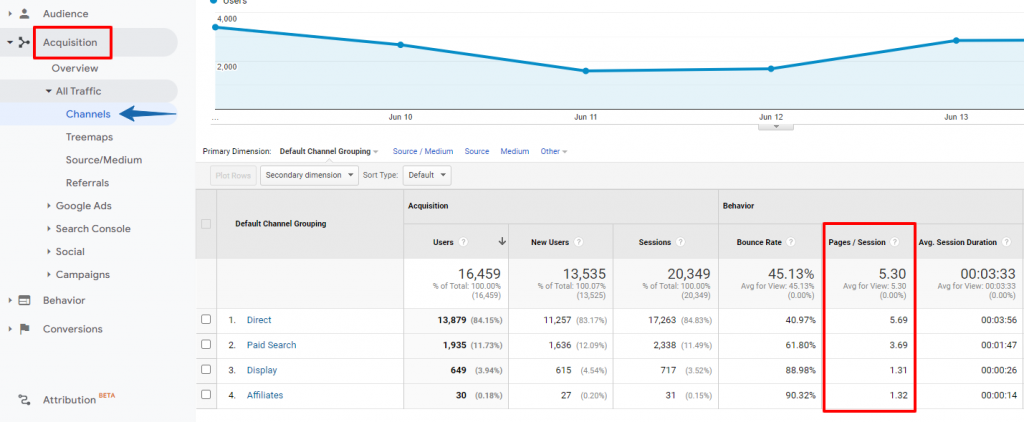
Universal Analytics:
- Go to the Acquisition tab on the side panel.
- Click All Traffic and select Channels.
Google Analytics 4:
In GA4 you don’t have direct access to the Page Per Session metric. But you can follow the instructions given in this GA resource and replicate pages/screens per session goals as a GA4 audience.
Quick Tips to Increase Pages Per Session
- Include related posts recommendations in content
- Interlink different content resources that align with the buyer’s journey
- Adopt a pillar-cluster content strategy and cross-link the pillar and cluster content
7. Traffic Sources
Traffic Sources data allows you to track how users reach your website. Some of the most prominent sources of traffic include organic search, referrals, paid search, email, direct, etc.
While there’s no ideal distribution for traffic sources, organic search is the major source of traffic. You need to keep a tab on your traffic sources so that you can create, distribute, and promote your content accordingly.
How to Track
Universal Analytics:
- Go to the Acquisition tab on the side panel.
- Click All Traffic and select Source/Medium.
Google Analytics 4:
- Go to the Acquisition tab on the side panel.
- Click Traffic Acquisition.
Quick Tips to Improve Traffic Sources
- To increase organic search traffic, strengthen your SEO and content marketing efforts.
- To get more referral traffic, build backlinks and leverage social media.
- To improve direct traffic, invest in brand-building efforts.
- To get more email traffic, use email marketing strategies.
8. New vs Returning Visitors
New visitors are the users that visited your site for the first time in the selected period. Google Analytics uses the client ID to track new or unique visitors.
This means that if the same person accesses your website from three different devices — desktop, tablet, mobile, etc. — GA will show this as three unique visitors. Also, if the user clears their browser cookies and revisits your site, it would be counted as a unique visit.
That’s why you should always account for such factors while analysing new users’ data.
On the other hand, Google Analytics identifies the users who have visited your site previously in the last two years as returning visitors.
The new and returning users both are important for your business website. A steadily growing new user base indicates that your top-of-the-funnel content is working and the site is able to attract potential customers.
Whereas, a high percentage of returning visitors means that your site is providing consistent value and that’s why users keep coming back. Returning visitors are more likely to convert into paying customers.
Thus, you need a balance in the New vs Returning Visitors metric.
How to Track
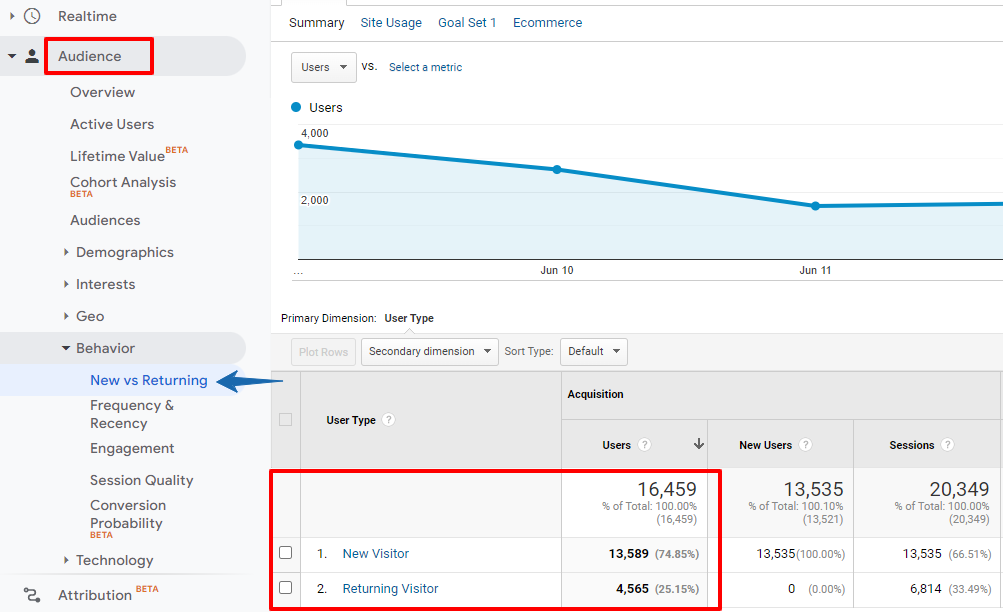
Universal Analytics:
- Go to the Audience tab.
- Click the Behaviour drop-down and select New vs Returning.
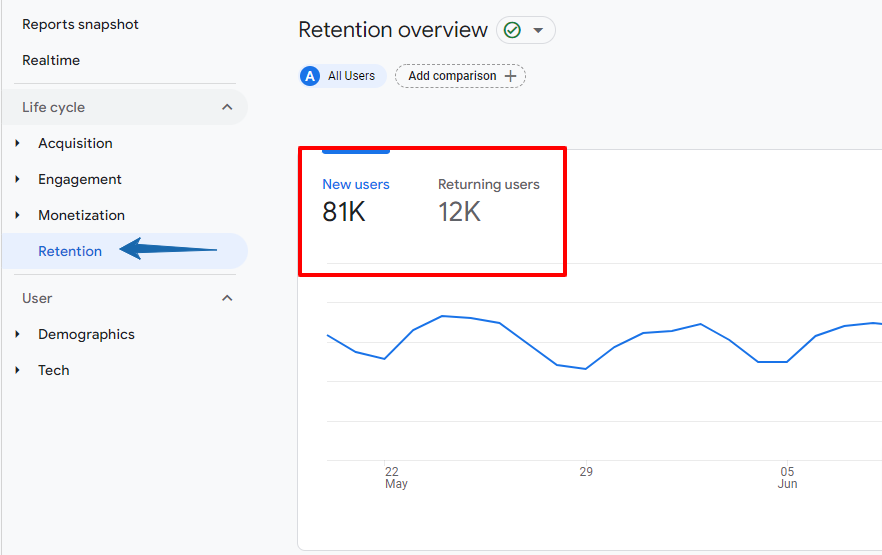
Google Analytics 4:
In GA4, there’s a separate tab for retention metrics. So just click the Retention tab on the side panel and you’ll be able to view the data for new and returning users on your site.
Quick Tips to Optimise New vs Returning Visitors
- Invest in digital marketing channels such as SEO, PPC, email marketing, social media marketing, etc. to attract new users to your site.
- Create stellar TOFU, MOFU, and BOFU content to acquire, retain, and convert visitors.
- Focus on brand building. Direct traffic is mostly the returning visitors that know your brand very well and type your site’s URL in a browser.
9. Top Exit Pages
The Exit Page is the last page that a user accessed before leaving your site.
In a way, every page can be an exit page but when you track the Top Exit Pages, you can determine whether users are leaving important pages instead of the exit page that you aim for. For example, the “Thank you page” or “Download page”.
Let’s say, you’ve designed a certain path on your site that aligns to the buyer’s journey and you want users to follow the path. Now if you want to determine whether users are exiting from the intended exit pages or important pages, check Top Exit Pages report.
If the majority of users are leaving the pages that are meant for higher engagement or conversion, then you may want to look into the issues and correct them.
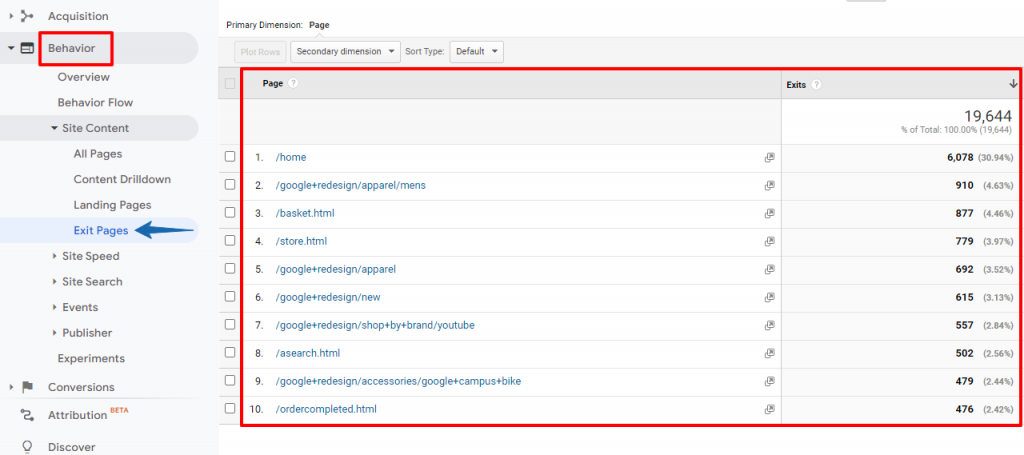
How to Track
Universal Analytics:
- Go to the Behaviour tab on the side panel.
- Click Site Content drop-down and select Exit Pages.
Google Analytics 4:
In GA4, Exit Pages are not available in the standard reports. But GA4 allows you to create custom reports for your desired metrics.
Here, watch this video to learn how you can create custom reports for Top Exit Pages in GA4.
Quick Tips to Optimise Top Exit Pages
- Create a coherent information structure
- Plan and implement a well-thought-out internal linking strategy
- Place clear CTAs — strategically
Start Tracking the Engagement
The main purpose of building a business website is to drive traffic and then convert visitors into leads and paying customers.
While engagement metrics are not directly related to your revenue and profits, they certainly contribute a great deal to your conversion rate. That’s why you must track them.
By tracking the engagement metrics, you’d get the insights that help you improve your website and content which can ultimately lead to optimising your buyers’ journey.
So follow the steps and tips shared in this guide and start tracking your website engagement metrics. Also, avoid drawing conclusions by analysing any metric in isolation. Instead, analyse them in clusters to get accurate insights.
Besides, if you need any help with web analytics and optimisation, feel free to reach out to us.
At your service, always 

-
Hardy Desai
Hardy is the visionary founder of Supple Digital, a boutique SEO agency based in Melbourne, Australia. With a profound understanding of the digital landscape and a deep passion for innovation, Hardy has steered Supple Digital to become a leading name in the SEO domain.


DIGITAL MARKETING FOR ALL OF AUSTRALIA

- SEO AgencyMelbourne

- SEO AgencySydney

- SEO AgencyBrisbane

- SEO AgencyAdelaide

- SEO AgencyPerth

- SEO AgencyCanberra

- SEO AgencyHobart

- SEO AgencyDarwin

- SEO AgencyGold Coast

- We work with all businesses across Australia
